|
Novus Biologicals
anti atg5 Anti Atg5, supplied by Novus Biologicals, used in various techniques. Bioz Stars score: 93/100, based on 1 PubMed citations. ZERO BIAS - scores, article reviews, protocol conditions and more https://www.bioz.com/product/atg+5/pm37456828-296-20-21?v=Novus+Biologicals Average 93 stars, based on 1 article reviews
anti atg5 - by Bioz Stars,
2026-07
93/100 stars
|
Buy from Supplier |
|
Proteintech
atg5 rabbit Atg5 Rabbit, supplied by Proteintech, used in various techniques. Bioz Stars score: 96/100, based on 1 PubMed citations. ZERO BIAS - scores, article reviews, protocol conditions and more https://www.bioz.com/product/atg+5/pmc05583183__41467_2017_498_MOESM1_ESM-60-92-95?v=Proteintech Average 96 stars, based on 1 article reviews
atg5 rabbit - by Bioz Stars,
2026-07
96/100 stars
|
Buy from Supplier |
|
Santa Cruz Biotechnology
atg5 sirna damarcon Atg5 Sirna Damarcon, supplied by Santa Cruz Biotechnology, used in various techniques. Bioz Stars score: 93/100, based on 1 PubMed citations. ZERO BIAS - scores, article reviews, protocol conditions and more https://www.bioz.com/product/atg+5/pmc03879535-128-31-28?v=Santa+Cruz+Biotechnology Average 93 stars, based on 1 article reviews
atg5 sirna damarcon - by Bioz Stars,
2026-07
93/100 stars
|
Buy from Supplier |
|
Novus Biologicals
atg5  Atg5, supplied by Novus Biologicals, used in various techniques. Bioz Stars score: 95/100, based on 1 PubMed citations. ZERO BIAS - scores, article reviews, protocol conditions and more https://www.bioz.com/product/atg+5/pmc07354588-75-10-22?v=Novus+Biologicals Average 95 stars, based on 1 article reviews
atg5 - by Bioz Stars,
2026-07
95/100 stars
|
Buy from Supplier |
|
Santa Cruz Biotechnology
atg5 Atg5, supplied by Santa Cruz Biotechnology, used in various techniques. Bioz Stars score: 96/100, based on 1 PubMed citations. ZERO BIAS - scores, article reviews, protocol conditions and more https://www.bioz.com/product/atg+5/pm25866222-49-28-46?v=Santa+Cruz+Biotechnology Average 96 stars, based on 1 article reviews
atg5 - by Bioz Stars,
2026-07
96/100 stars
|
Buy from Supplier |
|
Novus Biologicals
nb110 Nb110, supplied by Novus Biologicals, used in various techniques. Bioz Stars score: 94/100, based on 1 PubMed citations. ZERO BIAS - scores, article reviews, protocol conditions and more https://www.bioz.com/product/atg+5/pmc09926119-4-7-4?v=Novus+Biologicals Average 94 stars, based on 1 article reviews
nb110 - by Bioz Stars,
2026-07
94/100 stars
|
Buy from Supplier |
|
Novus Biologicals
atg5 antibody  Atg5 Antibody, supplied by Novus Biologicals, used in various techniques. Bioz Stars score: 93/100, based on 1 PubMed citations. ZERO BIAS - scores, article reviews, protocol conditions and more https://www.bioz.com/product/atg+5/bio_rxiv__2025__05__02__651776-129-21-23?v=Novus+Biologicals Average 93 stars, based on 1 article reviews
atg5 antibody - by Bioz Stars,
2026-07
93/100 stars
|
Buy from Supplier |
|
OriGene
flag human atg5  Flag Human Atg5, supplied by OriGene, used in various techniques. Bioz Stars score: 90/100, based on 1 PubMed citations. ZERO BIAS - scores, article reviews, protocol conditions and more https://www.bioz.com/product/atg+5/pmc09649694-279-0-13?v=OriGene Average 90 stars, based on 1 article reviews
flag human atg5 - by Bioz Stars,
2026-07
90/100 stars
|
Buy from Supplier |
|
OriGene
mer sirna duplexes Mer Sirna Duplexes, supplied by OriGene, used in various techniques. Bioz Stars score: 91/100, based on 1 PubMed citations. ZERO BIAS - scores, article reviews, protocol conditions and more https://www.bioz.com/product/atg+5/pm31944172-257-12-15?v=OriGene Average 91 stars, based on 1 article reviews
mer sirna duplexes - by Bioz Stars,
2026-07
91/100 stars
|
Buy from Supplier |
|
Elabscience Biotechnology
atg5 Atg5, supplied by Elabscience Biotechnology, used in various techniques. Bioz Stars score: 93/100, based on 1 PubMed citations. ZERO BIAS - scores, article reviews, protocol conditions and more https://www.bioz.com/product/atg+5/pm41430105-94-53-56?v=Elabscience+Biotechnology Average 93 stars, based on 1 article reviews
atg5 - by Bioz Stars,
2026-07
93/100 stars
|
Buy from Supplier |
|
Novus Biologicals
anti atg5 antibody ![TRIM44 promtoes aggregates deaggregation and clearance via autophagy. (a) Cells were treated with MG132 and immunostained with antibodies to ubiquitin (red) and LC3B-II (green). Arrows indicate ubiquitin-positive aggregates that colocalize with LC3B-positive autophagosomes. Scale bars: 10 μm. (b) Confocal images of TRIM44[OE-CON] and TRIM44[OE] U266 cells after treatment with MG132 (0.5 µM) for 16 h followed by a 24-h chase period in normal culture media with DMSO (vehicle), or 3-MA. Arrows indicate cells with remaining aggregates. The relative level of remaining aggregates is determinded by quantifying the percentage of cells with remaining aggregates after a 24-h chase period in normal culture media with DMSO (vehicle), or 3-MA (10 mM) and normalized to the percentage of cells with aggregates formed by the 16 h MG132 (0.5 µM) treatment in corresponding cells. *, P < 0.05; **, P < 0.01; ***, P < 0.001. Scale bars: 10 μm. (c) Confocal images of TRIM44[KD-CON] and TRIM44[KD] U266 cells after treatment with MG132 (0.5 µM) for 16 h followed by a 24-h chase period in normal culture media with DMSO (vehicle), or PP242 (10 nM). Arrows indicate cells with remaining aggregates. Scale bars: 10 µm. The relative level of remaining aggregates is determinded by quantifying the percentage of cells with remaining aggregates after a 24-h chase period in normal culture media with DMSO (vehicle), or PP242 (10 nM) and normalized to the percentage of cells with aggregates formed by the 16 h MG132 (0.5 µM) treatment in corresponding cells. *, P < 0.05; **, P < 0.01; ***, P < 0.001. Scale bars: 10 μm. (d, e) Confocal images of WT or <t>ATG5</t> KO TRIM44[OE-CON] and TRIM44[OE] U266 cells transfected with NC or ATG5 siRNA after treatment with MG132 (0.5 µM) for 16 h. Aggregates (marked by arrows) were identified by staining with the antibody against ubiquitin (d). Scale bars: 10 µm. The status of aggregates after MG132 treatment was quantified in the histogram. *, P < 0.05; **, P < 0.01; ***, P < 0.001. Scale bars: 10 μm. The protein level of ATG5 and TRIM44 were assayed by western blots (e). (f, g) Confocal images of WT or BECN1 KO TRIM44[OE-CON] and TRIM44[OE] U266 cells were treated with MG132 (0.5 µM) for 16 h. Aggregates (marked by arrows) were identified by staining with the antibody against ubiquitin (f). Scale bars: 10 µm. The status of aggregates after MG132 treatment was quantified in the histogram. *, P < 0.05; **, P < 0.01; ***, P < 0.001. Scale bars: 10 μm. The protein level of BECN1 and TRIM44 were assayed by western blot (g). (h, i) Confocal images of RPMI-TRIM44[Tet-on] cells treated with or without DOX (1 µg/mL) transfected with NC or ATG5 siRNA after treatment with MG132 (0.5 µM) for 16 h. The status of aggregates after MG132 treatment was quantified in the histogram. Scale bars: 10 µm. The status of aggregates after MG132 treatment was quantified in the histogram. *, P < 0.05; **, P < 0.01; ***, P < 0.001. Scale bars: 10 μm. The protein level of ATG5 and TRIM44 were assayed by western blots (h). (j) Confocal images of RPMI-TRIM44[Tet-on] cells treated with or without DOX (1 µg/mL) together with MG132 (5 µM) for 16 h followed by a 24-h chase period in normal culture media with DMSO (vehicle), or 3-MA. Arrows indicate cells with remaining aggregates. The relative level of remaining aggregates is determinded by quantifying the percentage of cells with remaining aggregates after a 24-h chase period in normal culture media with DMSO (vehicle), or 3-MA and normalized to the percentage of cells with aggregates formed by the 16 h MG132 (5 µM) treatment in corresponding cells. *, P < 0.05; **, P < 0.01; ***, P < 0.001. Scale bars: 10 μm.](https://pub-med-central-images-cdn.bioz.com/pub_med_central_ids_ending_with_7492/pmc09037492/pmc09037492__KAUP_A_1956105_F0006_OC.jpg) Anti Atg5 Antibody, supplied by Novus Biologicals, used in various techniques. Bioz Stars score: 94/100, based on 1 PubMed citations. ZERO BIAS - scores, article reviews, protocol conditions and more https://www.bioz.com/product/atg+5/pmc09037492-352-31-33?v=Novus+Biologicals Average 94 stars, based on 1 article reviews
anti atg5 antibody - by Bioz Stars,
2026-07
94/100 stars
|
Buy from Supplier |
|
R&D Systems
mouse anti atg5 Mouse Anti Atg5, supplied by R&D Systems, used in various techniques. Bioz Stars score: 90/100, based on 1 PubMed citations. ZERO BIAS - scores, article reviews, protocol conditions and more https://www.bioz.com/product/atg+5/pmc06423575-65-8-22?v=R%26D+Systems Average 90 stars, based on 1 article reviews
mouse anti atg5 - by Bioz Stars,
2026-07
90/100 stars
|
Buy from Supplier |
Image Search Results
Journal: Viruses
Article Title: Reduced-Beclin1-Expressing Mice Infected with Zika-R103451 and Viral-Associated Pathology during Pregnancy
doi: 10.3390/v12060608
Figure Lengend Snippet: ZIKV infection in Becn1 +/+ and Becn1 +/− pregnant dams. ( A ) Schematic diagram illustrating Zika virus (ZIKV)-infection in timed-pregnant dams. Prior to viral infection, pregnant dams received the antibody MAR1-5A3 at 2 mg/animal via intraperitoneal (ip) route at gestational day 8 followed by subcutaneous (sc) infection with ZIKV at 10 3 plaque-forming unit (PFU) in 50 µL of PBS or mock (PBS) injection at gestational day E9. ( B ) Representative Western Blots probed with antibodies against several autophagy proteins, and B-actin was used as an internal control. Adult Becn1 +/+ and Becn1 +/− brains were removed postmortem and minced according to the Materials and Methods. ( C ) Densitometric analysis using image J indicate the levels of p62, Beclin1, ATG5, LC3-I and LC3-II in brains of adult Becn1 +/+ (black bar) and Becn1 +/− (brown bar) mice. The error bars show mean ± SEM for N = 3 animals per treatment. The data were analyzed using GraphPad Prism and two-way analysis of variance (ANOVA) followed by Tukey’s test. * p < 0.05 and ** p < 0.01 vs. Becn1 +/+ . ( D ) Weight gain, expressed in grams, was measured using an analytical balance at gestation day 0 and throughout gestation period, at 3-day intervals. ( E ) Percent survival rate in pregnant dams infected with ZIKV or mock (PBS) was calculated by dividing the total number of live animals by the number of live + dead animals X 100. ( F ) Viral RNA detected in serum collected from ZIKV-infected dams on E13. ( G ) Viral RNA detected in organs removed postmortem from ZIKV-infected dams on E17. ( D – G ) Error bars show mean ± SEM for N = 5–8 animals per treatment. The data were analyzed using GraphPad Prism and two-way ANOVA followed by Tukey’s test. * p < 0.05 vs. Becn1 +/+ . ( F , G ) Viral RNA equivalent is expressed on a log10 scale after comparison with a standard curve produced using serial 10-fold dilutions of ZIKV RNA from known quantities of infectious virus.
Article Snippet: Immunoblots were labeled with primary antibodies against Beclin1 (Catalog# NB500–249),
Techniques: Infection, Virus, Injection, Western Blot, Control, Mass Measurement, Comparison, Produced
Journal: bioRxiv
Article Title: Loss of ATG5 expression in a subset of human prostate cancers promotes tumor growth through accumulation of p62
doi: 10.1101/2025.05.02.651776
Figure Lengend Snippet: ( A ) Visualization of the deletions, amplifications, and somatic mutations of ATG5 and other PCa-associated genes from the TCGA prostate adenocarcinoma (PRAD) dataset (n = 492). The image was exported from cBioPortal. ( B ) Genome-wide somatic copy number alterations (SCNAs) from 97 curated and paired TCGA PRAD samples. Frequently altered autophagy-related (ATG) genes are highlighted below, along with neighboring oncogenes or tumor suppressor genes. The image was exported from Nexus Copy Number™. ( C ) Oncomine™ analysis of microarray mRNA expression datasets for ATG5 and other PCa-associated genes. Genes are ranked based on the significance of mRNA under-expression in prostate tumors compared to normal tissue. Genes ranking in the top 25%, 10%, 5% and 1% of all examined genes in a given dataset are indicated with increasingly deep blue color. The p-value for a given gene was calculated from the median ranks across all 15 microarray datasets. ( D ) Oncomine™ analysis of PCa-related genes for prostate metastases compared to primary tumors. See also Supplementary Figure S1 and Supplementary Figure S2A.
Article Snippet: Slides were cooled for 20 min, washed with water, blocked with Biocare Blocking Reagent (#BS966M) for 10 min and incubated in
Techniques: Genome Wide, Microarray, Expressing
![( A ) Tukey boxplot of ATG5 mRNA expression levels in normal prostate tissue, low-grade (Gleason score ≤7) tumors, and high-grade (Gleason score >8) tumors from the TCGA PRAD dataset (*, p<0.01; **, p<0.0001). ( B ) Kaplan-Meier curves comparing overall survival of TCGA PRAD patients possessing tumors with high or low ATG5 mRNA expression. The Mantel-Haenszel hazard ratio (HR) was determined, along with the 95% confidence interval (CI) and Log-rank test p-value (p<0.05). ( C ) Quantification of ATG5 IHC staining was determined from patient samples (N=28) with ≥3 benign and tumor glands for in-patient comparison using the following equation: H-score = [1 x (% cells 1+) + 2 x (% cells 2+) + 3 x (% cells 3+)]. Statistical significance (p<0.0001) was determined using a two-tailed Mann Whitney test in Prism10. ( D ) Representative images of ATG5 staining from benign glandular regions and tumor regions from human prostate tumors of GS7-9. Scale bar represents 100 μm. Dashed box areas are magnified within the insets.](https://bio-rxiv-images-cdn.bioz.com/dois_ending_with_76/10__1101_slash_2025__05__02__651776/10__1101_slash_2025__05__02__651776___F2.large.jpg)
Journal: bioRxiv
Article Title: Loss of ATG5 expression in a subset of human prostate cancers promotes tumor growth through accumulation of p62
doi: 10.1101/2025.05.02.651776
Figure Lengend Snippet: ( A ) Tukey boxplot of ATG5 mRNA expression levels in normal prostate tissue, low-grade (Gleason score ≤7) tumors, and high-grade (Gleason score >8) tumors from the TCGA PRAD dataset (*, p<0.01; **, p<0.0001). ( B ) Kaplan-Meier curves comparing overall survival of TCGA PRAD patients possessing tumors with high or low ATG5 mRNA expression. The Mantel-Haenszel hazard ratio (HR) was determined, along with the 95% confidence interval (CI) and Log-rank test p-value (p<0.05). ( C ) Quantification of ATG5 IHC staining was determined from patient samples (N=28) with ≥3 benign and tumor glands for in-patient comparison using the following equation: H-score = [1 x (% cells 1+) + 2 x (% cells 2+) + 3 x (% cells 3+)]. Statistical significance (p<0.0001) was determined using a two-tailed Mann Whitney test in Prism10. ( D ) Representative images of ATG5 staining from benign glandular regions and tumor regions from human prostate tumors of GS7-9. Scale bar represents 100 μm. Dashed box areas are magnified within the insets.
Article Snippet: Slides were cooled for 20 min, washed with water, blocked with Biocare Blocking Reagent (#BS966M) for 10 min and incubated in
Techniques: Expressing, Immunohistochemistry, Comparison, Two Tailed Test, MANN-WHITNEY, Staining
Journal: bioRxiv
Article Title: Loss of ATG5 expression in a subset of human prostate cancers promotes tumor growth through accumulation of p62
doi: 10.1101/2025.05.02.651776
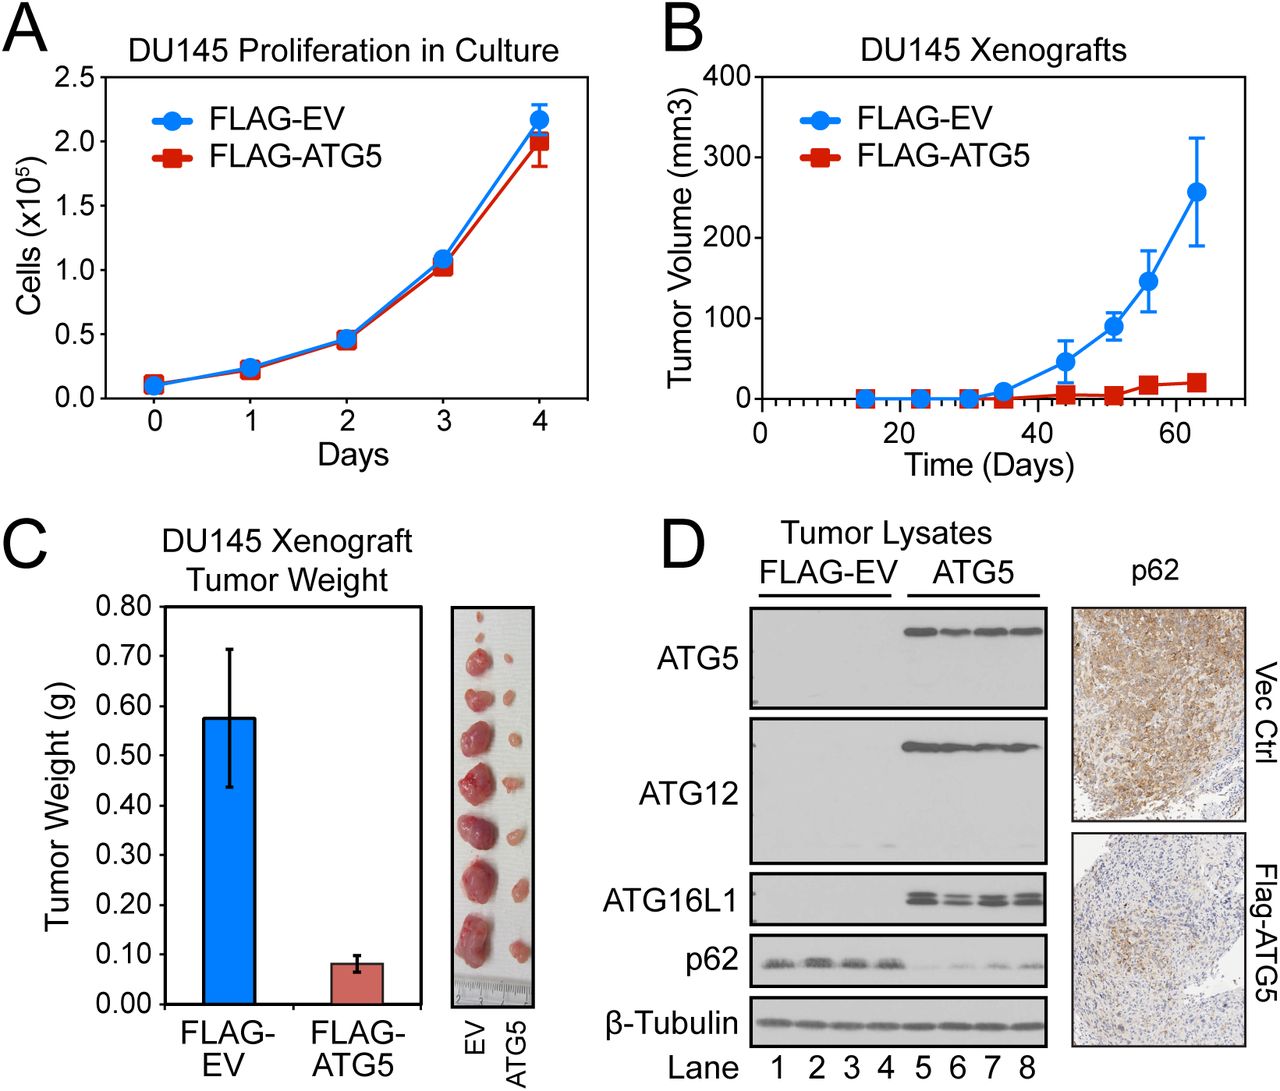
Figure Lengend Snippet: (A and B) 1×10 4 DU145 PCa cells, stably expressing firefly luciferase fused to mCherry and an empty vector (EV) or FLAG-ATG5, were plated in duplicate into 6-well plates. Total cell numbers were quantified daily by flow cytometry for 5 days. The same cell lines were likewise injected subcutaneously into the flanks of NOD/SCID mice, and xenograft tumor growth was determined by weekly measurements of luciferase activity using the IVIS Spectrum in vivo imaging system. (C) Mice were sacrificed and the tumors from empty vector (EV) and FLAG-ATG5-expressing DU145 xenografts were harvested, weighed and photographed. (D) Lysates were prepared from EV (lanes 1-4) and FLAG-ATG5-expressing tumors (lanes 5-8) and immunoblotted for the ATG12–ATG5-ATG16L1 complex and p62. IHC was also performed for p62 on representative tumors.
Article Snippet: Slides were cooled for 20 min, washed with water, blocked with Biocare Blocking Reagent (#BS966M) for 10 min and incubated in
Techniques: Stable Transfection, Expressing, Luciferase, Plasmid Preparation, Flow Cytometry, Injection, Activity Assay, In Vivo Imaging

Journal: bioRxiv
Article Title: Loss of ATG5 expression in a subset of human prostate cancers promotes tumor growth through accumulation of p62
doi: 10.1101/2025.05.02.651776
Figure Lengend Snippet: ( A ) Tukey boxplot of p62 reverse phase protein array (RPPA) expression levels in low-grade (Gleason score ≤7) and high-grade (Gleason score >8) tumors from the TCGA PRAD RPPA dataset. ***, p<0.0001. (B) Kaplan-Meier curves comparing overall survival of TCGA PRAD patients possessing tumors with high or low p62 RPPA expression. The Mantel-Haenszel hazard ratio (HR) was determined, along with the 95% confidence interval (CI) and Log-rank test p-value (p<0.05). ( C ) Tukey boxplot of SQSTM1 mRNA expression levels in low-grade (Gleason score ≤7) and high-grade (Gleason score >8) tumors from the TCGA PRAD dataset. **, p<0.001; ns, not significant. ( D ) Structure of p62 with its various functional domains and impacted signaling pathways. ( E ) DU145 cells were made deficient in p62 through CRISPR/Cas9-mediated deletion of SQSTM1 , and then infected with ATG5-expressing lentiviruses. ( F ) Wild-type and p62-deficient (p62 KO) cells – as well as those expressing ATG5 (DU145-ATG5 and DU145-ATG5-p62 KO) – were injected into both flanks of female NOD/SCID mice (0.5 x 10 6 cells per injection) and the resulting tumors were measured twice per week using calipers. Wild-type DU145 cells produced tumors larger than any other group by day 46 (p<0.01), and DU145-ATG5 cells produced tumors larger than p62-deficient cells only on day 63 (p<0.01). ( F ) Proposed model for how loss of ATG5 results in increased tumor growth.
Article Snippet: Slides were cooled for 20 min, washed with water, blocked with Biocare Blocking Reagent (#BS966M) for 10 min and incubated in
Techniques: Protein Array, Expressing, Functional Assay, Protein-Protein interactions, CRISPR, Infection, Injection, Produced
Journal: Cell Death & Disease
Article Title: Novel protein complexes containing autophagy and UPS components regulate proteasome-dependent PARK2 recruitment onto mitochondria and PARK2-PARK6 activity during mitophagy
doi: 10.1038/s41419-022-05339-x
Figure Lengend Snippet: A Representative western blot image showing endogenous PSMA7 and ATG5-12 protein levels in total cell lysate (Input) and ATG5-immunoprecipitated lysate (ATG5-IP) in HEK 293 T cells. Actin beta (ACTB) was used as loading control. B Graph representing the levels of immunoprecipitated PSMA7 protein with ATG5-12, normalized to ATG5-12 in HEK 293 T cells (mean ± SEM, n = 3). C Representative western blot image showing endogenous PSMA7 and ATG5-12 protein levels in total cell lysate (Input) and ATG5-immunoprecipitated lysate (ATG5-IP) in MEF cells. ACTB was used as loading control. D Graph representing the levels of immunoprecipitated PSMA7 protein with ATG5-12, normalized to ATG5-12 in MEF cells (mean ± SEM, n = 3). E Representative images of immunoprecipitation of FLAG and western blot analysis of PARK2 and PSMA7 in HEK 293 T cells co-transfected with MYC-PARK2 and/or FLAG-PSMA7. HEK 293 T cells were treated with STAURO (1 μM), CCCP (10 μM) or DMSO for 12 h after transfection and immunoprecipitation using Flag beads . F Quantification of PARK2 protein levels immunoprecipitated with PSMA7 from E , normalized to PSMA7 (mean ± SEM, n = 3). G and I , Representative western blot images showing the levels of PARK2 and PARK6 proteins respectively, immunoprecipitated with endogenous ATG5 in HA-PARK2 expressing HEK 293 T cells following DMSO or CCCP treatment (10 μM) for 12 h. H and J , Graphs showing the quantification of PARK2 (from G ) and PARK6 (from I ) protein levels, normalized to endogenous ATG5-12 (mean ± SEM, n = 3). K and L , SILAC-MS/MS-based interactome results as fold change graphs of ATG5 enrichment ( K ) and CCCP-induced PSMA7-ATG5 complex enrichment ( L ) as compared to control. M and N , Fold change graphs of PSMA7 enrichment ( M ) and CCCP-induced PARK2-PSMA7 complex enrichment ( N ). O and P , Confocal microscopy images of HEK 293 T cells co-transfected with GFP-PSMA7 (green) and pmCherry-ATG5 (red) constructs and treated with CCCP (10 μM) or STAURO for 12 h ( O ) and treated with CCCP (20 μM) or Oligomycin A/Antimycin A (O/A, 10 μM) for 2 h ( P ). R and S , overlap coefficiency graphs representing PSMA7 (green) and ATG5 (red) colocalization following 12 h (R) and 2 h ( S ) of treatments ( n = 60). T and U , Confocal microscopy images of HeLa cells that were co-transfected with pEGFP-PSMA7 (green) and pmCherry-PARK2 (red) constructs, and treated with staurosporine (1 μM, 12 h) or CCCP (10 μM, 12 h) ( T ) and CCCP or O/A for 2 h ( U ). V and Y , Overlap coefficiency graphs representing PSMA7 (green) and PARK2 (red) colocalization after 12 h ( V , n = 30) and 2 h ( Y , n = 91) of treatments. MERGE, overlay of green and red signals. ZOOM, zoomed images of particular area. Significance in R , S , V and Y was determined using one-way ANOVA.
Article Snippet:
Techniques: Western Blot, Immunoprecipitation, Control, Transfection, Expressing, Multiplex sample analysis, Tandem Mass Spectroscopy, Confocal Microscopy, Construct

Journal: Cell Death & Disease
Article Title: Novel protein complexes containing autophagy and UPS components regulate proteasome-dependent PARK2 recruitment onto mitochondria and PARK2-PARK6 activity during mitophagy
doi: 10.1038/s41419-022-05339-x
Figure Lengend Snippet: A Representative western blot images showing PSMA7, PARK2, ATG5-12, TIM23 and Actin beta (ACTB) protein levels in cytoplasmic (Cytosol) and mitochondrial (Mito) fractions of YFP-PARK2 transfected HEK 293 T cells treated with DMSO or CCCP (10 µM, 12 h). B Quantification graph corresponding to mitochondrial protein levels of PARK2, PSMA7 and ATG5-12 in A . Mitochondrial protein levels were normalized to TIM23 (mean ± S.D., n = 3). C Representative western blot images showing PSMA7, PARK2, ATG5-12, VDAC1, and ACTB protein levels in cytoplasmic (Cytosol) and mitochondrial (Mito) fractions of HA-PARK2 overexpressing HeLa cells treated with DMSO or CCCP (20 µM, 2 h) or O/A (10 µM, 2 h). D Quantification graph corresponding to protein levels of PARK2, PSMA7 and ATG5-12 in C . Mitochondrial protein levels were normalized to VDAC1 (mean ± S.D., n = 3). E Confocal microscopy analysis of HeLa cells co-transfected with pEGFP-PSMA7 (green) and mito-dsRed (red) constructs, and treated with DMSO or CCCP for 12 h (upper panel) and DMSO, CCCP or O/A for 2 h (lower panel). MERGE, overlay of green and red signals. F and G Overlap coefficiency graphs representing PSMA7 (green) and mitochondria (red) colocalization during 12 h ( F , n = 68) and 2 h ( G , n = 62) treatments. H Confocal microscopy analysis of HeLa cells co-transfected with YFP-ATG5 (green) and mito-dsRed (red) constructs and treated with DMSO or CCCP for 12 h (upper panel) and CCCP or O/A for 2 h (lower panel). I and J Overlap coefficiency graphs representing ATG5 (green) and mitochondria (red) colocalization during 12 h ( I , n = 87) and 2 h ( J , n = 60) treatments. K Confocal microscopy analysis of HeLa cells that were co-transfected with YFP-PARK2 (green) and mito-dsRed (red) constructs and treated with DMSO or CCCP 12 h (upper panel) and DMSO, CCCP or O/A for 2 h (lower panel). L and M , Overlap coefficiency graphs representing PARK2 (green) and mitochondria (red) colocalization during 12 h ( L , n = 30) and 2 h (M , n = 30) treatments. MERGE, overlay of green and red signals. Ordinary one-way ANOVA test ( G, J and M ) or two-tail t-test ( F, I and L ) used for statistical analysis.
Article Snippet:
Techniques: Western Blot, Transfection, Confocal Microscopy, Construct

Journal: Cell Death & Disease
Article Title: Novel protein complexes containing autophagy and UPS components regulate proteasome-dependent PARK2 recruitment onto mitochondria and PARK2-PARK6 activity during mitophagy
doi: 10.1038/s41419-022-05339-x
Figure Lengend Snippet: A and C , Western blot images representing the levels of PARK2, PARK6, VDAC1, PSMA7, PSMB5 and ATG5-12 following gel filtration chromatography performed using mitochondrial lysates collected from YFP-PARK2 expressing HEK 293 T cells treated with either DMSO ( A ) , or CCCP ( C) for 12 h. M, mitochondrial extracts before fractionation. L-PARK6, uncleaved/unprocessed form of PARK6 (63 kDa). S-PARK6, cleaved/processed form of PARK6 (55 kDa). B and D , Quantifications of PARK2 relative intensity in A and C respectively ( n = 3). E and F , Graphs showing SILAC-MS/MS enrichments of ATG5 ( E ) and PARK2-ATG5 complex ( F ) in mitochondrial fraction ( n = 3).
Article Snippet:
Techniques: Western Blot, Filtration, Chromatography, Expressing, Fractionation, Multiplex sample analysis, Tandem Mass Spectroscopy

Journal: Cell Death & Disease
Article Title: Novel protein complexes containing autophagy and UPS components regulate proteasome-dependent PARK2 recruitment onto mitochondria and PARK2-PARK6 activity during mitophagy
doi: 10.1038/s41419-022-05339-x
Figure Lengend Snippet: A, Representative western blot images of PARK2, VDAC1, ATG5-12 and ACTB in mitochondrial fractions of YFP-PARK2 expressing HEK 293 T cells transfected with control vector or ATG5 specific shRNA vector (shATG5), and treated with DMSO or CCCP (10 µM) for 12 h. B Graph representing the quantification of mitochondria localized PARK2 from A (mean ± SEM, n = 3). C Representative confocal images of YFP-PARK2 (green) and mito-dsRed (red) expressing HeLa cells co-transfected with control vector (CNT) or shATG5 vector, and treated with DMSO or CCCP (10 µM) for 12 h. MERGE, overlay of green and red signals. D Graph showing colocalization coefficiency of PARK2 overlap with mitochondria from C (mean ± S.D., n≥30, one-way ANOVA). E Representative western blot images of MFN2, PARK2, ATG5-12 and ACTB in MYC-PARK2 over expressing wild type (WT) and ATG5 knockout (KO) HeLa cells treated with DMSO or CCCP (10 µM) for 12 h. ACTB was used as loading control. F , Quantification of MFN2 levels from E (mean ± SEM, n = 3). G , Representative western blot images of phosphoSer65-ubiquitin (pSer65-UB) and total ubiquitin (UB) levels in MYC-PARK2 expressing wild type (WT) and ATG5 knockout (KO) HeLa cells treated with DMSO, CCCP (20 μM, 2 h) or MG132 (30 μM, 2.5 h) and CCCP (20 μM, 2.5 h). Band intensities were marked below ( n = 3). H Confocal images of GFP-optineurin (OPTN, green) and mito-dsRed (red) expressing HeLa cells co-transfected with control vector or shATG5 vector, and treated with DMSO or CCCP (10 μM) for 12 h. MERGE, overlay of green and red signals. ZOOM, zoomed images of particular area. I Quantification graph showing the overlap coefficiency values of optineurin dots (green) and mitochondria (red) from H (mean ± S.D., n ≥ 30, one-way ANOVA).
Article Snippet:
Techniques: Western Blot, Expressing, Transfection, Control, Plasmid Preparation, shRNA, Knock-Out, Ubiquitin Proteomics
Journal: Autophagy
Article Title: TRIM44 links the UPS to SQSTM1/p62-dependent aggrephagy and removing misfolded proteins
doi: 10.1080/15548627.2021.1956105
Figure Lengend Snippet: TRIM44 promtoes aggregates deaggregation and clearance via autophagy. (a) Cells were treated with MG132 and immunostained with antibodies to ubiquitin (red) and LC3B-II (green). Arrows indicate ubiquitin-positive aggregates that colocalize with LC3B-positive autophagosomes. Scale bars: 10 μm. (b) Confocal images of TRIM44[OE-CON] and TRIM44[OE] U266 cells after treatment with MG132 (0.5 µM) for 16 h followed by a 24-h chase period in normal culture media with DMSO (vehicle), or 3-MA. Arrows indicate cells with remaining aggregates. The relative level of remaining aggregates is determinded by quantifying the percentage of cells with remaining aggregates after a 24-h chase period in normal culture media with DMSO (vehicle), or 3-MA (10 mM) and normalized to the percentage of cells with aggregates formed by the 16 h MG132 (0.5 µM) treatment in corresponding cells. *, P < 0.05; **, P < 0.01; ***, P < 0.001. Scale bars: 10 μm. (c) Confocal images of TRIM44[KD-CON] and TRIM44[KD] U266 cells after treatment with MG132 (0.5 µM) for 16 h followed by a 24-h chase period in normal culture media with DMSO (vehicle), or PP242 (10 nM). Arrows indicate cells with remaining aggregates. Scale bars: 10 µm. The relative level of remaining aggregates is determinded by quantifying the percentage of cells with remaining aggregates after a 24-h chase period in normal culture media with DMSO (vehicle), or PP242 (10 nM) and normalized to the percentage of cells with aggregates formed by the 16 h MG132 (0.5 µM) treatment in corresponding cells. *, P < 0.05; **, P < 0.01; ***, P < 0.001. Scale bars: 10 μm. (d, e) Confocal images of WT or ATG5 KO TRIM44[OE-CON] and TRIM44[OE] U266 cells transfected with NC or ATG5 siRNA after treatment with MG132 (0.5 µM) for 16 h. Aggregates (marked by arrows) were identified by staining with the antibody against ubiquitin (d). Scale bars: 10 µm. The status of aggregates after MG132 treatment was quantified in the histogram. *, P < 0.05; **, P < 0.01; ***, P < 0.001. Scale bars: 10 μm. The protein level of ATG5 and TRIM44 were assayed by western blots (e). (f, g) Confocal images of WT or BECN1 KO TRIM44[OE-CON] and TRIM44[OE] U266 cells were treated with MG132 (0.5 µM) for 16 h. Aggregates (marked by arrows) were identified by staining with the antibody against ubiquitin (f). Scale bars: 10 µm. The status of aggregates after MG132 treatment was quantified in the histogram. *, P < 0.05; **, P < 0.01; ***, P < 0.001. Scale bars: 10 μm. The protein level of BECN1 and TRIM44 were assayed by western blot (g). (h, i) Confocal images of RPMI-TRIM44[Tet-on] cells treated with or without DOX (1 µg/mL) transfected with NC or ATG5 siRNA after treatment with MG132 (0.5 µM) for 16 h. The status of aggregates after MG132 treatment was quantified in the histogram. Scale bars: 10 µm. The status of aggregates after MG132 treatment was quantified in the histogram. *, P < 0.05; **, P < 0.01; ***, P < 0.001. Scale bars: 10 μm. The protein level of ATG5 and TRIM44 were assayed by western blots (h). (j) Confocal images of RPMI-TRIM44[Tet-on] cells treated with or without DOX (1 µg/mL) together with MG132 (5 µM) for 16 h followed by a 24-h chase period in normal culture media with DMSO (vehicle), or 3-MA. Arrows indicate cells with remaining aggregates. The relative level of remaining aggregates is determinded by quantifying the percentage of cells with remaining aggregates after a 24-h chase period in normal culture media with DMSO (vehicle), or 3-MA and normalized to the percentage of cells with aggregates formed by the 16 h MG132 (5 µM) treatment in corresponding cells. *, P < 0.05; **, P < 0.01; ***, P < 0.001. Scale bars: 10 μm.
Article Snippet: Anti-TRIM44 polyclonal antibody (Proteintech Group, 11,511-1-AP); anti-Ub antibody (Biolegend, 646,301); anti-mCherry antibody (ThermoFisher, PA5-34,974); anti-VIM antibody (ThermoFisher, MA5-11,883); anti-NFE2L2/NRF2 antibody (ThermoFisher, PA5-27,882); anti-20S proteasome antibody (MilliporeSigma, ST1049); anti-TUBG/γ-Tubulin antibody (MilliporeSigma, T5326);
Techniques: Ubiquitin Proteomics, Transfection, Staining, Western Blot